Dashboard
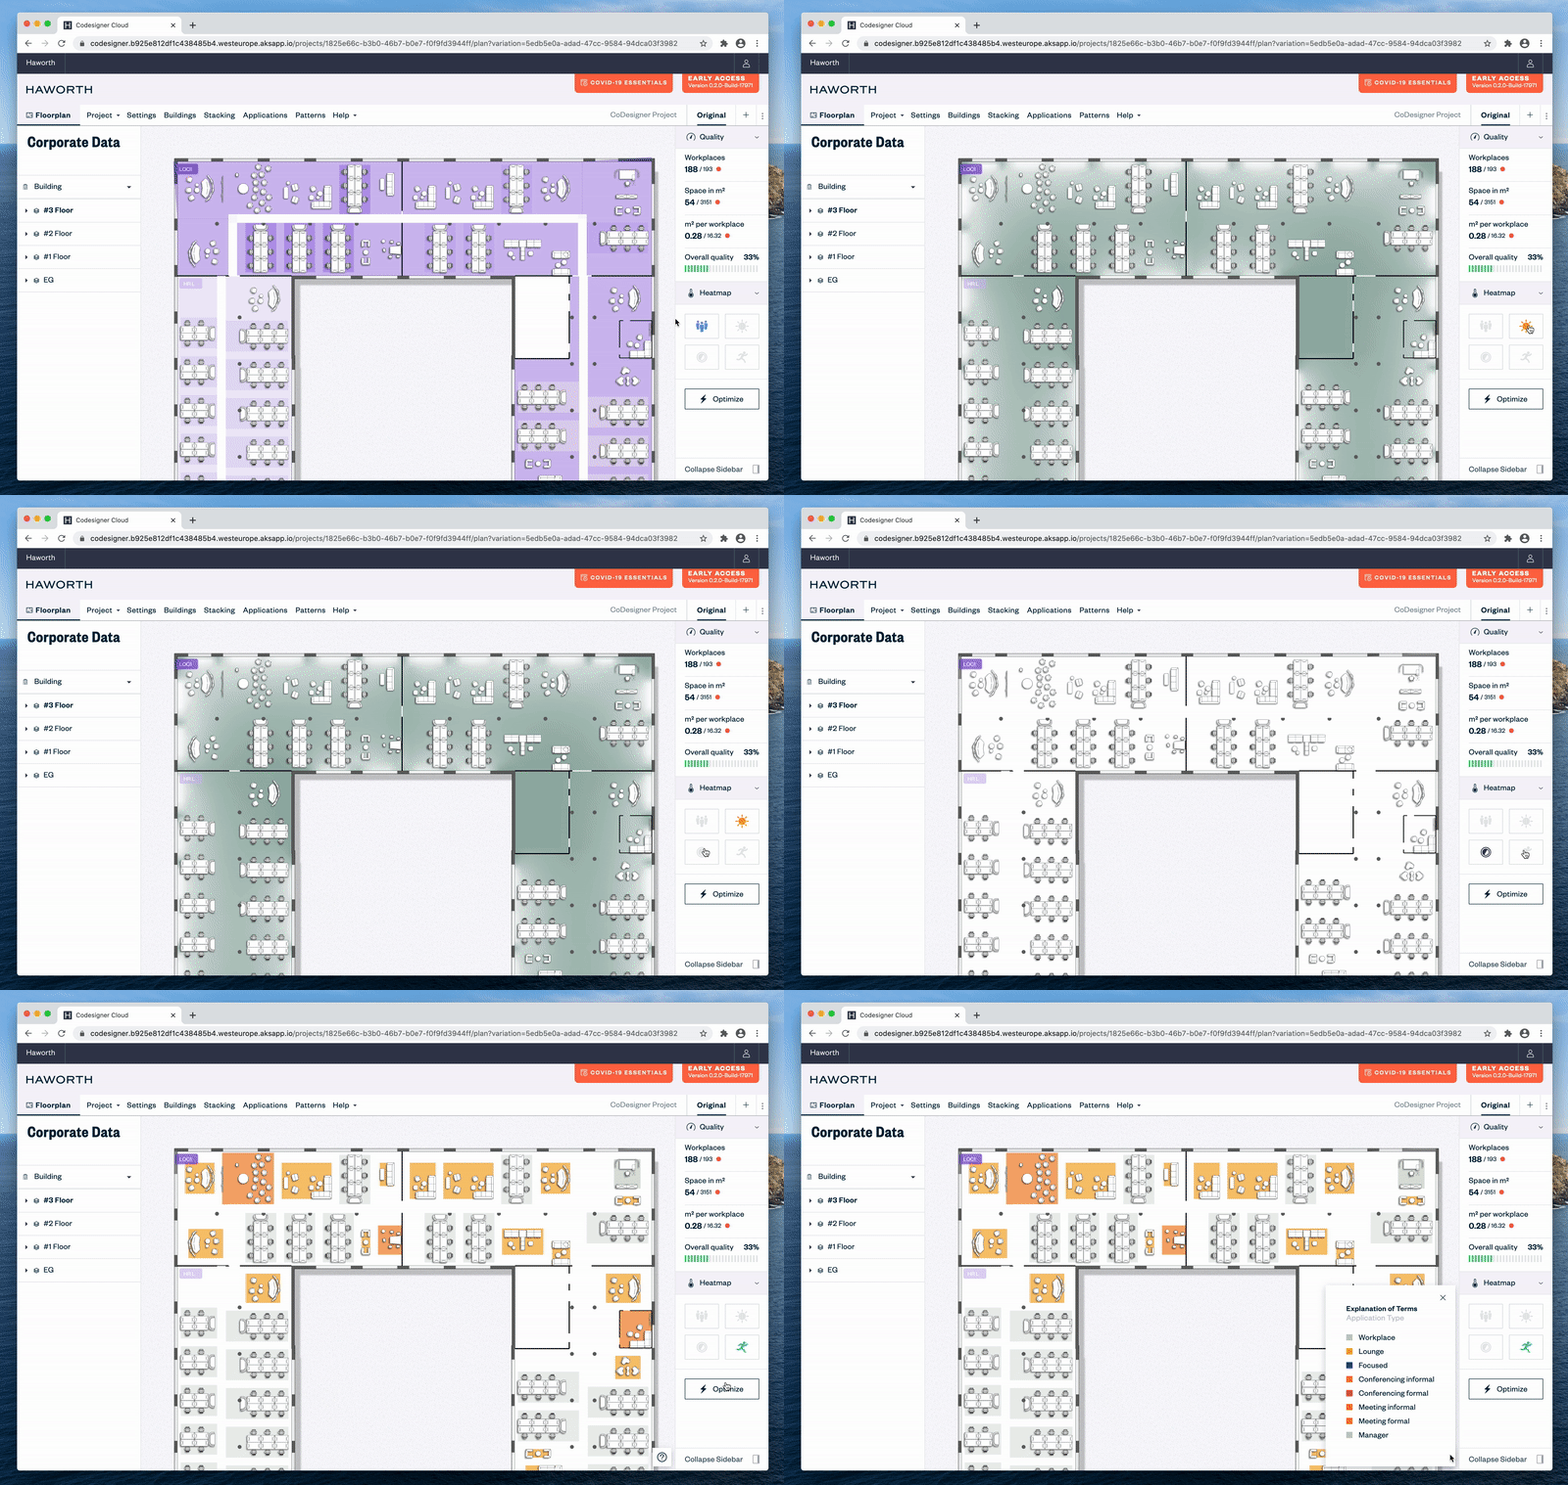
CoDesigner’s dashboard is located on the right side of the window. There you’ll find information about the quality of the floor plan, access to change the view of the floorplan using different heat maps and most importantly the Optimize button, which will cause CoDesigner to recalculate the entire floor plan.
How to collapse and expand the dashboard
If you want an unrestricted view of the floor plan, you can collapse the dashboard. Use the “Collapse Sidebar” button at the bottom of the dashboard. If you click on one of the smaller tabs, the dashboard will open again with the unfolded tab.
To display the entire dashboard again, click on the button at the bottom again.


A) Quality
The quality display in the upper area of CoDesigner’s dashboard always refers to what is selected. If no Subdepartment or Team is selected, the values refer to the entire floorplan.
Workplaces shows how many workplaces in total or per selected item are effectively available.
Space in sqm is the value how much space is available in total or per selected item in square meters.
Sqm per workplace describes how many square meters are allocated per workplace.
For each category, the first larger number represents the actual value and the second smaller number represents the required value. The small circle at the end visualizes the quality of the target value. If it is green, the actual value corresponds to the required value, if it is red, it does not.
Overall quality
Among all numerical values you’ll find a barometer, which shows the overall quality of the floorplan or selected item in percent. It combines all these values to give you a quick overview of the quality of your floor plan.
